I wanted to elaborate more here, on what I am attempting to do.
The goal is to create a GRC file to show how sampling rates affect a generated signal. Knowing, for real samples, fs (sampling rate, "samp_rate) would be greater than twice that of the highest bandwidth (f, "freq"), I created a flow graph where one can adjust the frequency whilst keeping the sampling rate constant.
I would have imagined (since fs > 2B) for any frequency I set past 1/2*fs, I would see distortion, and anything less would yield accurate results.
--
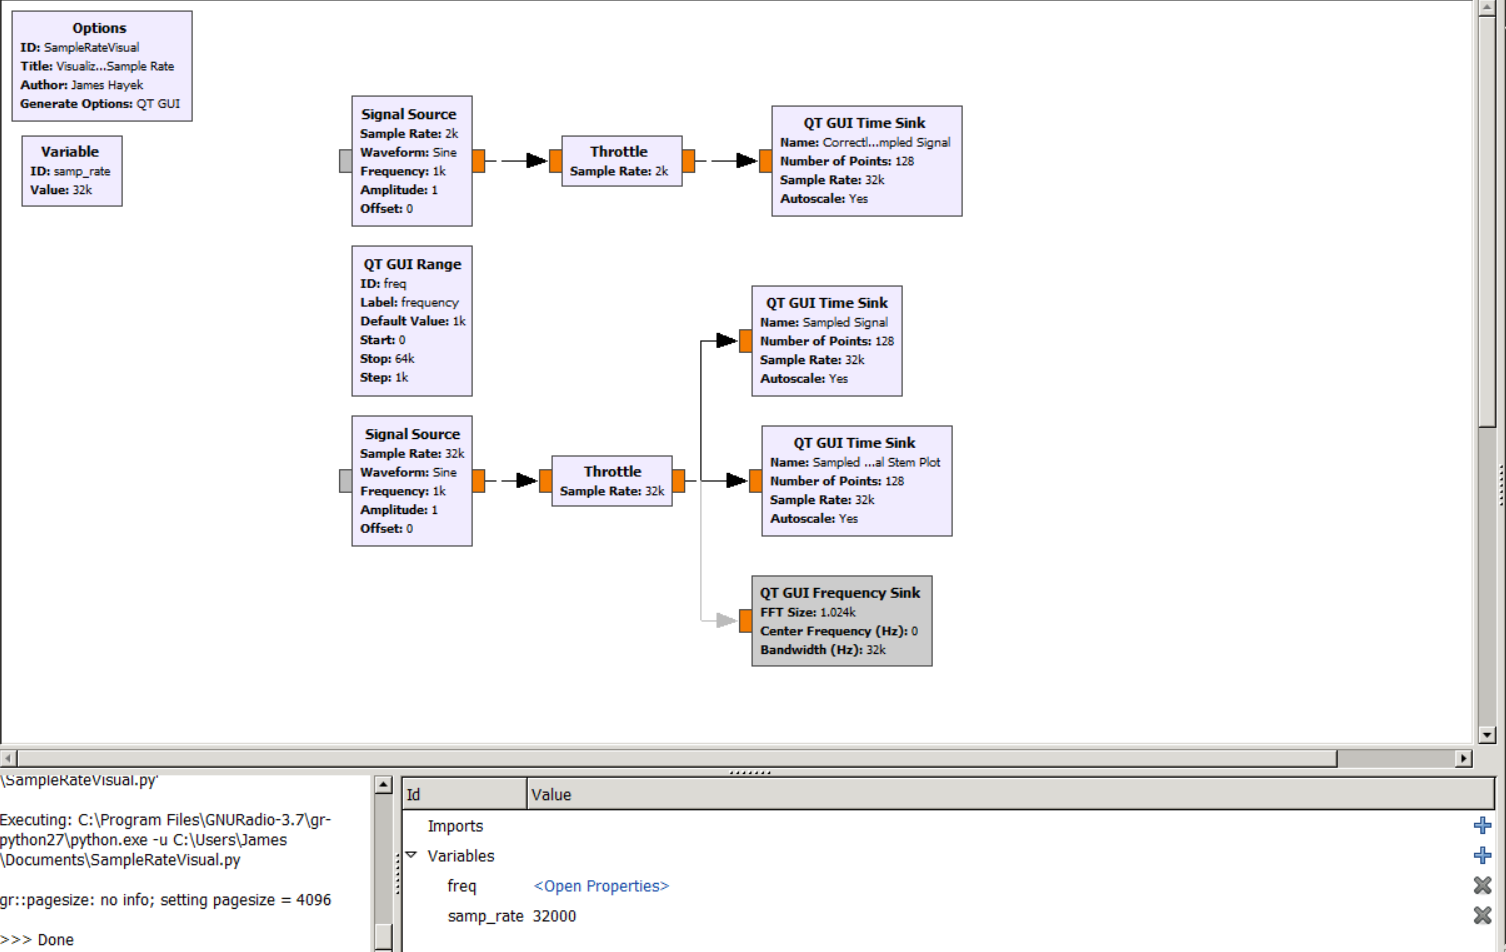
I created two sine wave Signal Sources. One where the sample rate was set to freq*2 and the frequency was set to an adjustable variable, freq.
The other where the sample rate was set to a fixed samp_rate and the frequency
was set to the same adjustable variable, freq.
Both signals output to a QT GUI Time SInk. When I run the program, I see the signal using a sampling rate of freq*2 is distorted (triangular waveform) and the signal with the fixed sampling rate distorts past a frequency of 1K Hz. I have the sampling rate to 32KSps. Wouldn't it distort around 16KHz? What have I set up incorrectly?
.GRC file attached. Thanks in advance!
Thanks,
James G Hayek
James G Hayek
Youtube.com/JamesHayek