[Top][All Lists]
[Date Prev][Date Next][Thread Prev][Thread Next][Date Index][Thread Index]
Re: [Orgmode] org-babel and gnuplot
|
From: |
John Hendy |
|
Subject: |
Re: [Orgmode] org-babel and gnuplot |
|
Date: |
Wed, 8 Sep 2010 14:04:33 -0500 |
Nick,
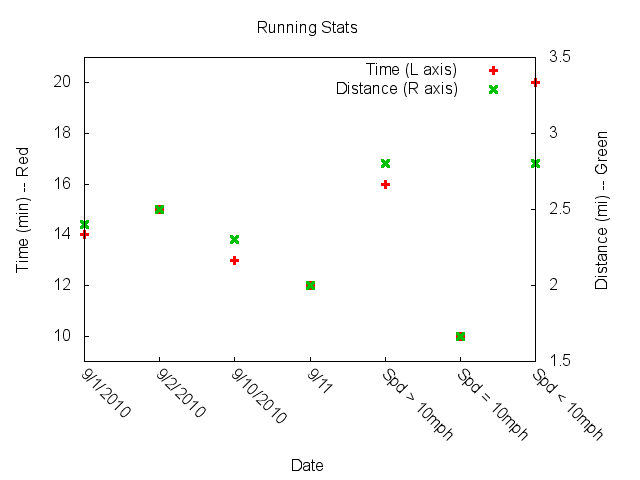
How about this?? Just fiddled around a little and wonder what you think. There might be a better way, but essentially, I've done the following:
- Left y-axis = distance
- Right y-axis = time
- I couldn't get the xtic(1) option to work, so I replaced things with what I've found to work x:y:xticlabels(col#)
- Beefed up the points to make them a little easier to see
- Used your data to "calibrate" your speed
--- The left y-axis is from 9-21min
--- The right y-axis is from 1.5min - 3.5min
--- This means the axes are 'calibrated' to 10mph
What does the "calibration" do? It means that at a quick glance you can see your speed based on a target rate you set:
- if speed/distance are on top of each other, you're right at your target
- if speed (green) is higher than distance (red), you were faster than your target
- if speed (green) is lower than distance (red), you were slower than your target
Resetting your target is as easy as changing (in the code below):
- Time: yrange [y1:y2]
- Distance: y2range [y3:y4]
All you have to do is make sure that y3/y1 = y4/y2 = target speed
Also, remove the references to L/R and Red/Green if you'd like from the labels. I just tried to make the labels as easy as possible to follow so that no matter where you looked for a reference you would be forced to see what color/axis matched what value.
I attached a sample graph. Sorry if I overstepped my bounds -- I realize it's your workout tracker. Take what you like and ditch the rest. I wanted to know how to do two different y axes anyway so it helped me learn. Code is here:
------------------- gnuplot code -----------------------
#+tblname: sessions
| Date | ID | Time | Distance |
|-------------+----+-------+----------|
| 9/1/2010 | 1 | 14:00 | 2.4 |
| 9/2/2010 | 2 | 15:13 | 2.5 |
| 9/10/2010 | 3 | 13:45 | 2.3 |
| 9/11 | 4 | 12:20 | 2.0 |
| Spd > 10mph | 5 | 16:35 | 2.8 |
| Spd = 10mph | 6 | 10 | 1.666 |
| Spd < 10mph | 7 | 20 | 2.8 |
#+begin_src gnuplot :var data="" :file org-running.png :exports both
reset
set title "Running Stats"
set size ratio square
set xlabel "Date"
set xtics nomirror rotate by -45
set yrange [9:21]
set ylabel "Time (min) -- Red"
set ytics nomirror
set y2range [1.5:3.5]
set y2label "Distance (mi) -- Green"
set y2tics 0,0.5,3.5
set style data points
plot data u 2:3:xticlabels(1) axis x1y1 lw 3 title 'Time (L axis)', \
data u 2:4 axis x2y2 lw 3 title 'Distance (R axis)'
#+end_src
------------------- end gnuplot code ---------------------
Best regards,
John
On Wed, Sep 8, 2010 at 11:52 AM, Nick Parker
<address@hidden> wrote:
John,
I am reworking the gnuplot script, it is not done at this point, but this is what I currently have:
#+begin_src gnuplot :var data="" :file org-running.png :exports both
set title "Running Stats"
set xtics nomirror rotate by -45
set key noenhanced
set style data linespoints
plot "$data" using 2:xtic(1) title columnheader(1), \
for [i=2:3] '' using i title columnheader(i)
On Wed, Sep 8, 2010 at 9:39 AM, John Hendy
<address@hidden> wrote:
Nick,
This got me curious to see the output. I tried to generate it on my computer and get this in the *gnuplot* buffer after running the code:
-----
gnuplot> plot data using 1:2:3 notitle
^
warning: Skipping data file with no valid points
^
x range is invalid
-----
This is working for you, though?
#+tblname: sessions
| Date | Time | Distance |
|------------+-------+----------|
| 09/02/2010 | 15:13 | 2.5 |
| 09/01/2010 | 14:00 | 2.4 |
#+begin_src gnuplot :var data="" :file org-running.png :exports both
set title "Running Stats"
set auto x
set style data histogram
set style fill solid border -1
set boxwidth .9
set xlabel "Date"
set ylabel "Time"
plot data using 1:2:3 notitle
#+end_src
John
On Wed, Sep 8, 2010 at 8:10 AM, Nick Parker
<address@hidden> wrote:
Erik,
That was the issue, the :file reference needed to be on the line above. Thanks.
On Tue, Sep 7, 2010 at 10:27 PM, Erik Iverson
<address@hidden> wrote:
On 09/07/2010 10:12 PM, Nick Parker wrote:
Hi John,
I would actually like to plot different lines per distance, each
that correlate to a date and elapsed-time (x and y axis respectively).
I get an error with the :file notation, though I read that in a sample
babel gnuplot example for generating graphs of commit history on the
org-mode git repository. I tried to reference the variable data without
the quotes and $ sign without any success. I will continue to fiddle
with it, I am new to gnuplot.
multiple lines. Is that how you actually have it in your
org file?
#+begin_src gnuplot :var data="">
:file org-running.png :exports both
set title "Running Stats"
set auto x
set style data histogram
set style fill solid border -1
set boxwidth .9
set xlabel "Date"
set ylabel "Time"
plot "$data" using 1:2:3 notitle
#+end_src
Nick Parker
www.developernotes.com <http://www.developernotes.com>
_______________________________________________
Emacs-orgmode mailing list
Please use `Reply All' to send replies to the list.
address@hidden <mailto:address@hidden>
 org-running.png
Description: PNG image
- [Orgmode] org-babel and gnuplot, Nick Parker, 2010/09/07
- Re: [Orgmode] org-babel and gnuplot, John Hendy, 2010/09/07
- Re: [Orgmode] org-babel and gnuplot, Nick Parker, 2010/09/07
- Re: [Orgmode] org-babel and gnuplot, Erik Iverson, 2010/09/07
- Re: [Orgmode] org-babel and gnuplot, Nick Parker, 2010/09/08
- Re: [Orgmode] org-babel and gnuplot, John Hendy, 2010/09/08
- Re: [Orgmode] org-babel and gnuplot, John Hendy, 2010/09/08
- Re: [Orgmode] org-babel and gnuplot, Nick Parker, 2010/09/08
- Re: [Orgmode] org-babel and gnuplot,
John Hendy <=
- Re: [Orgmode] org-babel and gnuplot, Nick Parker, 2010/09/08