test2
Table of Contents
1 test 2: using pie chart without INFOJS
- an interactive plot
library(googleVis)
d <- data.frame(name=letters[1:5], value=1:5)
x <- gvisPieChart(d)
print(x, 'chart')
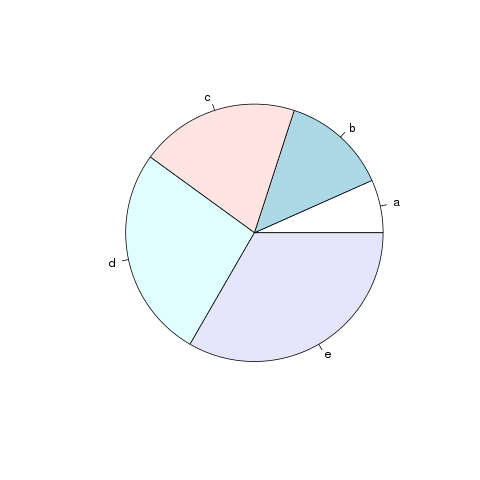
- a regular plot
pie(d$value, labels=d$name)
|
| From: | Feiming Chen |
| Subject: | [O] Bug: org html export INFOJS does not include an interactive plot in info view |
| Date: | Fri, 24 Aug 2012 09:59:58 -0700 (PDT) |
![]() plot.png
plot.png
Description: PNG image
library(googleVis)
d <- data.frame(name=letters[1:5], value=1:5)
x <- gvisPieChart(d)
print(x, 'chart')
pie(d$value, labels=d$name)
![]() test2.org
test2.org
Description: Binary data
library(googleVis) d <- data.frame(name=letters[1:5], value=1:5) x <- gvisPieChart(d) print(x, 'chart')
pie(d$value, labels=d$name)
![]() test1.org
test1.org
Description: Binary data
| [Prev in Thread] | Current Thread | [Next in Thread] |