[Date Prev][Date Next][Thread Prev][Thread Next][Date Index][Thread Index]
Re: Poor org-babel-tangle-file performance with more than 100 trivial no
|
From: |
Ihor Radchenko |
|
Subject: |
Re: Poor org-babel-tangle-file performance with more than 100 trivial noweb-references |
|
Date: |
Tue, 25 Jan 2022 22:11:25 +0800 |
pareto optimal <pareto.optimal@mailfence.com> writes:

> Using =emacs -Q= to tangle org files with more than over 100 noweb-refs gets
> slow fast.
>
> Given this org code for N=2:
> Using Gcc Emacs 28.0.91 (which I typicall use) I get these results:
>
> | N blocks | runtime | # of GCs |
> |----------+---------+----------|
> |       10 |   0.027 |        0 |
> |       20 |   0.049 |        0 |
> |       40 |   0.121 |        0 |
> |       80 |   0.391 |        0 |
> |      160 |   1.426 |        0 |
> |      320 |   6.765 |        0 |
> |      640 |  23.972 |        0 |
>
> so roughly it scales like:
>
> #+begin_example
> 0.8x (10-20)
> 2.5x  (20-40)
> 3x  (40-80)
> 3.5x  (160-320)
> 4x  (320-640)
> #+end_example
>
> Though I'm not sure how much that can tell us... my guess is noweb-ref's
> don't use a dictionary with =O(1)= lookups?

Thanks for the nice benchmark and for providing a test case!

You are using stable version of Org. We did some important performance
improvements on main. The same benchmark using latest main (26decec):

| N blocks | runtime | # of GCs |
|----------+---------+----------|
|       10 |   0.030 |        0 |
|       20 |   0.067 |        0 |
|       40 |   0.065 |        0 |
|       80 |   0.081 |        0 |
|      160 |   0.214 |        0 |
|      320 |   0.597 |        0 |
|      640 |   2.225 |        0 |
|     1280 |   9.221 |        0 |
|     2560 |  36.966 |        0 |

And with disabled self-verification code:
(setq org-element--cache-self-verify nil)
| N blocks | runtime | # of GCs |
|----------+---------+----------|
|       10 |   0.078 |        0 |
|       20 |   0.075 |        0 |
|       40 |   0.063 |        0 |
|       80 |   0.085 |        0 |
|      160 |   0.095 |        0 |
|      320 |   0.178 |        0 |
|      640 |   0.311 |        0 |
|     1280 |   0.819 |        0 |
|     2560 |   2.302 |        0 |
|     5120 |   8.878 |        0 |
|    10240 |  32.706 |        0 |

Graphical comparison:
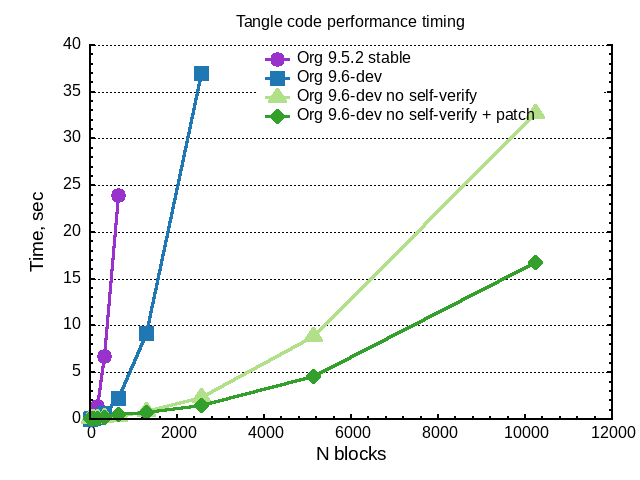
There is ~80x improvement.

However, the scaling is still not quite linear:
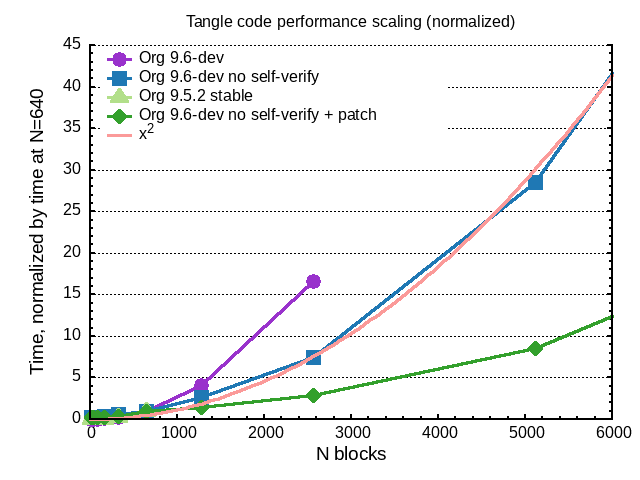
So, there is still some power-law nonlinearity in the tangle code.

Benchmarking revealed the following:
        8259  95%               - org-babel-tangle-file
        8259  95%                - org-babel-tangle
        8170  94%                 - org-babel-tangle-collect-blocks
        3620  41%                  - org-in-archived-heading-p
        3600  41%                     org-before-first-heading-p

Showing that nonlinear scaling comes from regexp search.

Caching org-before-first-heading-p improves the performance further (see
Org 9.6-dev no self-verify + patch curves):

| N blocks | runtime | # of GCs |
|----------+---------+----------|
|       10 |   0.118 |        0 |
|       20 |   0.106 |        0 |
|       40 |   0.136 |        0 |
|       80 |   0.157 |        0 |
|      160 |   0.139 |        0 |
|      320 |   0.212 |        0 |
|      640 |   0.542 |        0 |
|     1280 |   0.797 |        0 |
|     2560 |   1.533 |        0 |
|     5120 |   4.651 |        0 |
|    10240 |  16.745 |        0 |

The profiling gives:

       16817  63%                    - org-babel-tangle-file
       16280  61%                     - org-babel-tangle
       16200  61%                      - org-babel-tangle-collect-blocks
        1360   5%                       + org-babel-tangle-single-block
        1210   4%                       + org-babel-get-src-block-info

Most of the CPU time is spent in org-babel-tangle-collect-blocks, which
is basically another regexp search for all the source blocks in buffer.
The scaling is still slightly non-linear - maybe your source block
regexp is too complex:

(defvar org-babel-src-block-regexp
  (concat
   ;; (1) indentation                 (2) lang
   "^\\([ \t]*\\)#\\+begin_src[ \t]+\\([^ \f\t\n\r\v]+\\)[ \t]*"
   ;; (3) switches
   "\\([^\":\n]*\"[^\"\n*]*\"[^\":\n]*\\|[^\":\n]*\\)"
   ;; (4) header arguments
   "\\([^\n]*\\)\n"
   ;; (5) body
   "\\([^\000]*?\n\\)??[ \t]*#\\+end_src")
  "Regexp used to identify code blocks.")

On the other hand, the test data is already within quite non-realistic
over 5000 number of blocks. Probably, further performance improvement is
not very useful (we already have some overheads at smaller N).

Best,
Ihor

-----
The Org file used to generate plots:

#+name: nocache
| N blocks | runtime | # of GCs |
|----------+---------+----------|
|       10 |   0.027 |        0 |
|       20 |   0.049 |        0 |
|       40 |   0.121 |        0 |
|       80 |   0.391 |        0 |
|      160 |   1.426 |        0 |
|      320 |   6.765 |        0 |
|      640 |  23.972 |        0 |

#+name: cache
| N blocks | runtime | # of GCs |
|----------+---------+----------|
|       10 |   0.030 |        0 |
|       20 |   0.067 |        0 |
|       40 |   0.065 |        0 |
|       80 |   0.081 |        0 |
|      160 |   0.214 |        0 |
|      320 |   0.597 |        0 |
|      640 |   2.225 |        0 |
|     1280 |   9.221 |        0 |
|     2560 |  36.966 |        0 |

#+name: cache-no-self
| N blocks | runtime | # of GCs |
|----------+---------+----------|
|       10 |   0.078 |        0 |
|       20 |   0.075 |        0 |
|       40 |   0.063 |        0 |
|       80 |   0.085 |        0 |
|      160 |   0.095 |        0 |
|      320 |   0.178 |        0 |
|      640 |   0.311 |        0 |
|     1280 |   0.819 |        0 |
|     2560 |   2.302 |        0 |
|     5120 |   8.878 |        0 |
|    10240 |  32.706 |        0 |

#+name: cache-no-self+fix
| N blocks | runtime | # of GCs |
|----------+---------+----------|
|       10 |   0.118 |        0 |
|       20 |   0.106 |        0 |
|       40 |   0.136 |        0 |
|       80 |   0.157 |        0 |
|      160 |   0.139 |        0 |
|      320 |   0.212 |        0 |
|      640 |   0.542 |        0 |
|     1280 |   0.797 |        0 |
|     2560 |   1.533 |        0 |
|     5120 |   4.651 |        0 |
|    10240 |  16.745 |        0 |


#+begin_src gnuplot :var d1=nocache :var d2=cache :var d3=cache-no-self :var
d4=cache-no-self+fix :file benchmark1.png
set title 'Tangle code performance timing'
US='u 1:2 w lp ps 2'
set xlabel "N blocks"
set ylabel "Time, sec"
set key top right
plot d1 @US t'Org 9.5.2 stable', d2 @US t'Org 9.6-dev', d3 @US t'Org 9.6-dev no
self-verify', d4 @US t'Org 9.6-dev no self-verify + patch'
#+end_src

#+RESULTS[edd2a2d5d80b31876917faee349ed71ba0fe239a]:
[[file:/home/yantar92/.data/52/0930af-75ae-4d88-ae6a-d8dde39ecc72/benchmark1.png]]

#+begin_src gnuplot :var d1=nocache :var d2=cache :var d3=cache-no-self :var
d4=cache-no-self+fix :file benchmark2.png
set title 'Tangle code performance scaling (normalized)'
US='w lp ps 2'
set xlabel "N blocks"
set ylabel "Time, normalized by time at N=640"
set key top left
set xrange [0:6000]
plot d2 u 1:($2/2.225) @US t'Org 9.6-dev', d3 u 1:($2/0.311) @US t'Org 9.6-dev
no self-verify', d1 u 1:($2/23.972) @US t'Org 9.5.2 stable', d4 u 1:($2/0.542)
@US t'Org 9.6-dev no self-verify + patch', x*x/870000 t'x^2',
#+end_src

#+RESULTS[b170ef78ac377f6d2ad1c2eabb20cd62dc0ea33f]:
[[file:/home/yantar92/.data/52/0930af-75ae-4d88-ae6a-d8dde39ecc72/benchmark2.png]]