I call it simply spectrum too, maybe I should have said magnitude/phase spectrum.Now I'm confused. Magnitude spectrum is definitely my
 ;
but you're just looking for a plot of the DFT, right?
;
but you're just looking for a plot of the DFT, right?Indeed i don't need imaginary part in this case because the spectrum is realThat implies that your time signal is 0-time-hermitian (symmetrical if real)! In your example that is the case, because you're only summing up cosines, but it's not usually the case.
So I'd like to get back to my earlier question:
What is the purpose of this?
stream to vector -> FFT -> complex to real -> Qt Vector sink.
Again, not convinced that is what you actually *need*. It's just what I understnad that you *ask* for.
Best regards,
Marcus
I call it simply spectrum too, maybe I should have said magnitude/phase spectrum.
Indeed i don't need imaginary part in this case because the spectrum is real..... or not spectrum lines will be real numbers with + / - ...... or complex numbers with 0º/180º phase
The representation I would like to get is this one
or like this other
So, this way could do what I want to do
But I would like to print the magnitude/phase spectrm, but QT Frequency sink prints only the power spectrum
Is there any GUI sink wich can print this?
regards
El 26/04/17 a las 16:15, Marcus Müller escribió:
Hm, I'd call that spectrum, simply :) In any case, I don't fully understand, then, how you'd circumvent the need for a real and imaginary part. Your
Cheers,is complex!
Marcus
On 04/26/2017 03:46 PM, Fernando wrote:
Hi!.
I think the amplitude spectrum is the DFT:
So, it has sign. The power spectrum is the absolute value so it has no sign.
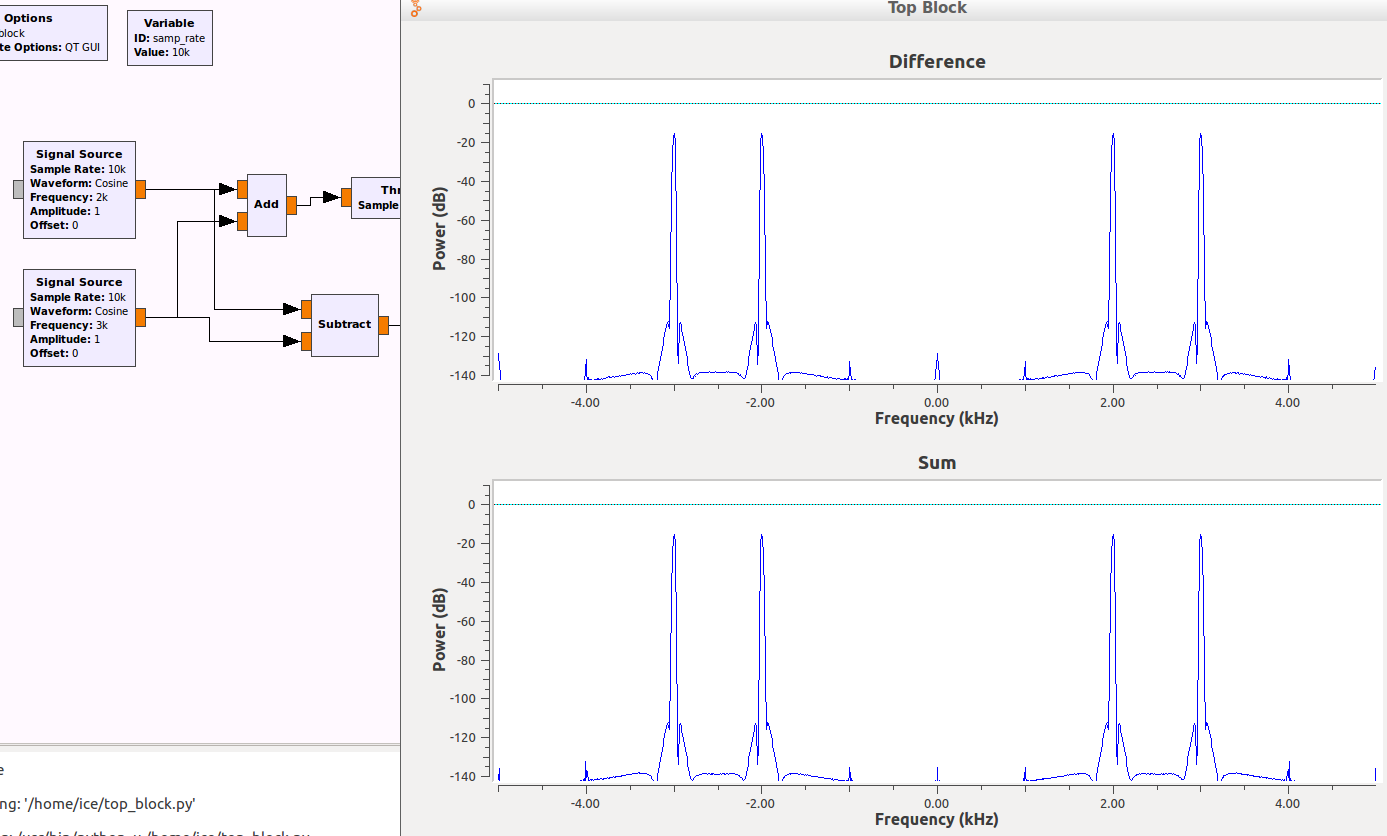
I wish to be able to see the difference in the spectrum between this two signals below. If the signal generators are A and B, A+B and A-B are different signals, but in the power spectrum we see them as the same signal, so I woul like to be able to difference one from the other from their spectrum.
regards
El 26/04/17 a las 09:52, Marcus Müller escribió:
Hey Fernando,
not quite sure I get what you need; I'd say the Amplitude Spectrum you'd be looking for is
or, rather, the decibel representation of that. There's no way to get a negative number out of the absolute of something – it's by definition a positive real number.
Now, we could also use our freedoms to define our amplitude spectrum to take the shape
But: that's really only useful if you have phase-coherent reception – as an analytic tool for an unsynchronized observation of the spectrum, it doesn't help you much, since you have a random
due to having random relative phase.
So, maybe it'd be a good idea to formulate what purpose you're doing this for :) You can, indeed, tell 180° out-of-phase signals apart by this, but I'd argue that being 180° out-of-phase, for the most things I can think of, is only meaningful on one and the same frequency – and hence, I'm not quite sure this is what you're looking for!
Best regards,
Marcus
On 25.04.2017 12:01, Fernando wrote:
Hello.
Yes, with Time sink I can see the difference, but if the signal is compound of some other signals (for instance signal=1K/amplitude +1 +2K/amplitude -1 +3K/qamplitude +1 +4K/amplitude +1 ) i would like to see the 2k signal as -1 amplitude, but in the power spectrum it will appear as possitive and in the QT time sink it is very difficult to see the signal as it is a complex one.
regards
El 25/04/17 a las 10:57, Jinyang Lee escribió:
Hello Fernando,
I think the QT GUI time sink displays the relationship between time and amplitude. You can see the signal through it. But when I use the channel model block,the QT2 can see the signal which is zero.Enclose is running result with channel model and with channel model.
Regards,Lee
2017-04-25 15:45 GMT+08:00 Fernando <address@hidden>:
Hi.
Is there a way of visualizing ampitude spectrum (with + and - signals)
instead of power spectrum?
regards
_______________________________________________
Discuss-gnuradio mailing list
address@hidden
https://lists.gnu.org/mailman/listinfo/discuss-gnuradio
_______________________________________________
Discuss-gnuradio mailing list
address@hidden
https://lists.gnu.org/mailman/listinfo/discuss-gnuradio
_______________________________________________ Discuss-gnuradio mailing list address@hidden https://lists.gnu.org/mailman/listinfo/discuss-gnuradio
![$$A_{|\cdot|}[f]=|X[f]| =
\left\lvert\sum_{n=0}^{N-1} x[n]\cdot e^{j2\pi \frac
{nf}N}\right\rvert $$](pngDNWTUGK7oR.png)
![$$A_\text{signed} = s(X[f]) |X[f]|\text{ with }
s(X[f])=\begin{cases}1&\text{for } -\pi \le \angle
X[f] < \pi \\ 0 &\text{else.} \end{cases}$$](pngdqfu2sI66j.png)